

4.1.4 Reading CSV data
CSV data is textual data formatted into m lines separated by
a character linesep, each of which contains n elements
separated by a character sep. Usually, linesep is
the newline character and sep is the comma or tab character.
The csv2gen command converts CSV data from files and strings
to Xcas matrices.
-
csv2gen takes one mandatory argument and up to five
optional arguments:
-
data, a string containing either CSV data or
the path to a CSV file.
- Optionally, sep, a string specifying the character
sep.
Note that Xcas will use only the first character in sep.
By default, sep=";". (Note that the tab character
is entered as \t.)
- Optionally, linesep, a string specifying the character
linesep.
Note that Xcas will use only the first character in linesep.
By default, linesep="\n" (line feed).
- Optionally, decsep, a string specifying the character
used as the decimal point.
Note that Xcas will use only the first character in decsep.
By default, decsep=",".
- Optionally, eof, a string or character specifying the end
of CSV data. Note that Xcas will use only the first character in eof
if it is a string. By default, eof=0 (the EOF character).
- Optionally, string, the symbol specifying that data
is CSV data and not a file name. This argument may always be appended to the input
sequence regardless of omitting some or all of the optional arguments above.
By default, data is interpreted as the file name.
- csv2gen(data,
⟨,sep ⟨,linesep ⟨,decsep ⟨,eof
⟩⟩⟩⟩ ⟨,string ⟩) returns
a matrix with m rows and n columns containing the CSV data. Numbers and other giac
expressions are automatically converted from strings.
- if decsep is given, then it is replaced by "." in the
imported matrix prior to stringnumber conversion. If your data
is using "." as the decimal point already (as is the Xcas standard)
and you have specified sep=",", then you do not have to set
decsep explicitly since there is no commas left after importing and attempting
to replace them will have no effect.
- If eof is given, then importing will stop as soon as the specified
character is read (it is subsequently discarded and therefore does not appear in the result).
- If there is some data missing in some line, i.e. when there are less than n
elements in a line, then Xcas will append zeros to the corresponding row of the output matrix.
- csv2gen skips empty lines; they will not be included in the result.
- Using csv2gen is a simple way to import data to Xcas from text files.
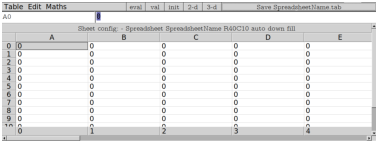
Equivalently, you can create a spreadsheet entry and use Table ▸ Insert CSV
from its menu bar (see Section 2.10).
Examples
To convert Matlab array syntax to a giac matrix:
| csv2gen("1 2 3; 4 5 6"," ",";",string) |
Assuming that the file hooke.csv (containing Hooke’s Law demo data) is downloaded
from here to the
Downloads folder, you can load it by typing e.g.
| hooke:=csv2gen("/home/luka/Downloads/hooke.csv",",") |
|
| |
| ⎡
⎢
⎢
⎢
⎢
⎢
⎢
⎢
⎢
⎢
⎢
⎢
⎢
⎢
⎣ | | “Index” | “Mass (kg)” | “Spring 1 (m)” | “Spring 2 (m)” |
| 1 | 0.0 | 0.05 | 0.05 |
| 2 | 0.49 | 0.066 | 0.066 |
| 3 | 0.98 | 0.087 | 0.08 |
| 4 | 1.47 | 0.116 | 0.108 |
| 5 | 1.96 | 0.142 | 0.138 |
| 6 | 2.45 | 0.166 | 0.158 |
| 7 | 2.94 | 0.193 | 0.174 |
| 8 | 3.43 | 0.204 | 0.192 |
| 9 | 3.92 | 0.226 | 0.205 |
| 10 | 4.41 | 0.238 | 0.232 |
| ⎤
⎥
⎥
⎥
⎥
⎥
⎥
⎥
⎥
⎥
⎥
⎥
⎥
⎥
⎦ |
| | | | | | | | | | |
|
The command
is a convenient way to obtain the table with the header row removed (see Section 6.1.5).
Application: loading and sorting real-world data
Assume that you require global annual mean temperature anomaly data for
the last two of centuries (it has been recorded since 1880).
The corresponding CSV file can be found
here. The file can
be imported in Xcas by entering:
| data:=csv2gen("/home/luka/Downloads/annual_csv.csv",","):;
header:=data[0] |
|
| |
| ⎡
⎣ | “Source”,“Year”,“Mean” | ⎤
⎦ |
| | | | | | | | | | |
|
There are three columns in the obtained table: Source, Year,
and Mean. The last column contains the mean anomalities
in degrees Celsius. To collect different data sources, enter:
| sources:=set[op(tail(col(data,0)))] |
There are two sources of data: GCAG and GISTEMP,
and the corresponding entries are interleaved. To sort data by source, enter:
| t:=table():;
for src in sources do
t[src]=<sort(tran([col(select(r->r[0]==src,data),1..2)]));
od:; |
Indeed, select selects the data rows in which the first element
is the source src; col returns a sequence containing the
second and third column, which is converted into a two-row matrix by using the
[] delimiters; tran transposes the matrix, returning
the desired list of pairs; finally, sort sorts the list according
to the lexicographic order (effectively along the first column, i.e. the time axis).
For instance, to plot the GCAG data, enter:
| gcag:=t["GCAG"]:;
labels=["year","°C"];
title="Annual mean temperature anomalies [°C]";
listplot(gcag) |


